Case Study 7: Incorporating tectonic information in probabilistic seismic hazard analysis: the effect of infrequent large earthquakes in the Malawi Rift

Michael Hodge, formerly MSc student at University of Bristol and currently PhD student at Cardiff University

Juliet Biggs, University of Bristol

Katsu Goda, University of Bristol

Willy Aspinall, University of Bristol

DOWNLOAD

THE CHALLENGE

The occurrence of a large earthquake involves a long strain accumulation process. The size of mapped fault segments can be used to estimate the characteristic magnitude via simple scaling relationships, and geodetic estimates of the rate of strain accumulation can be used to determine the associated recurrence interval. Such estimates of magnitude and frequency can be incorporated into a probabilistic hazard assessment. However, estimating characteristic magnitude and frequency of occurrence for an individual fault or fault system is a very uncertain proposition and depends strongly on assumptions. Testing sensitivity to different fault rupture scenarios is essential for contextualising a seismic hazard and interpreting results in the light of inherent uncertainty about physical mechanisms and our incomplete knowledge.

In this work, we illustrated how the geomorphology and geodesy of the Malawi Rift in Africa, a region with large seismogenic thicknesses, long fault scarps, slow strain rates, and a short historical record, can be used to assess hazard probability levels for large infrequent earthquakes through probabilistic seismic hazard analysis (PSHA).

WHAT WAS ACHIEVED

Our principal conclusion was that the Gutenberg-Richter magnitude-recurrence relationship, especially when based solely on a short instrumental catalogue, does not sufficiently capture seismicity potential in many tectonic settings. In areas where a characteristic earthquake model is more appropriate, geodetic and geomorphological information can be included to generate a synthetic earthquake catalogue suitable for probabilistic analysis. This approach, applied to the Malawi Rift, demonstrated that ignoring large, infrequent earthquakes tends to underestimate seismic hazard, particularly at the long vibration periods that disproportionally affect multi-storey constructions. We also found that the highest probabilistic hazard was associated with segmented ruptures.

HOW WE DID IT

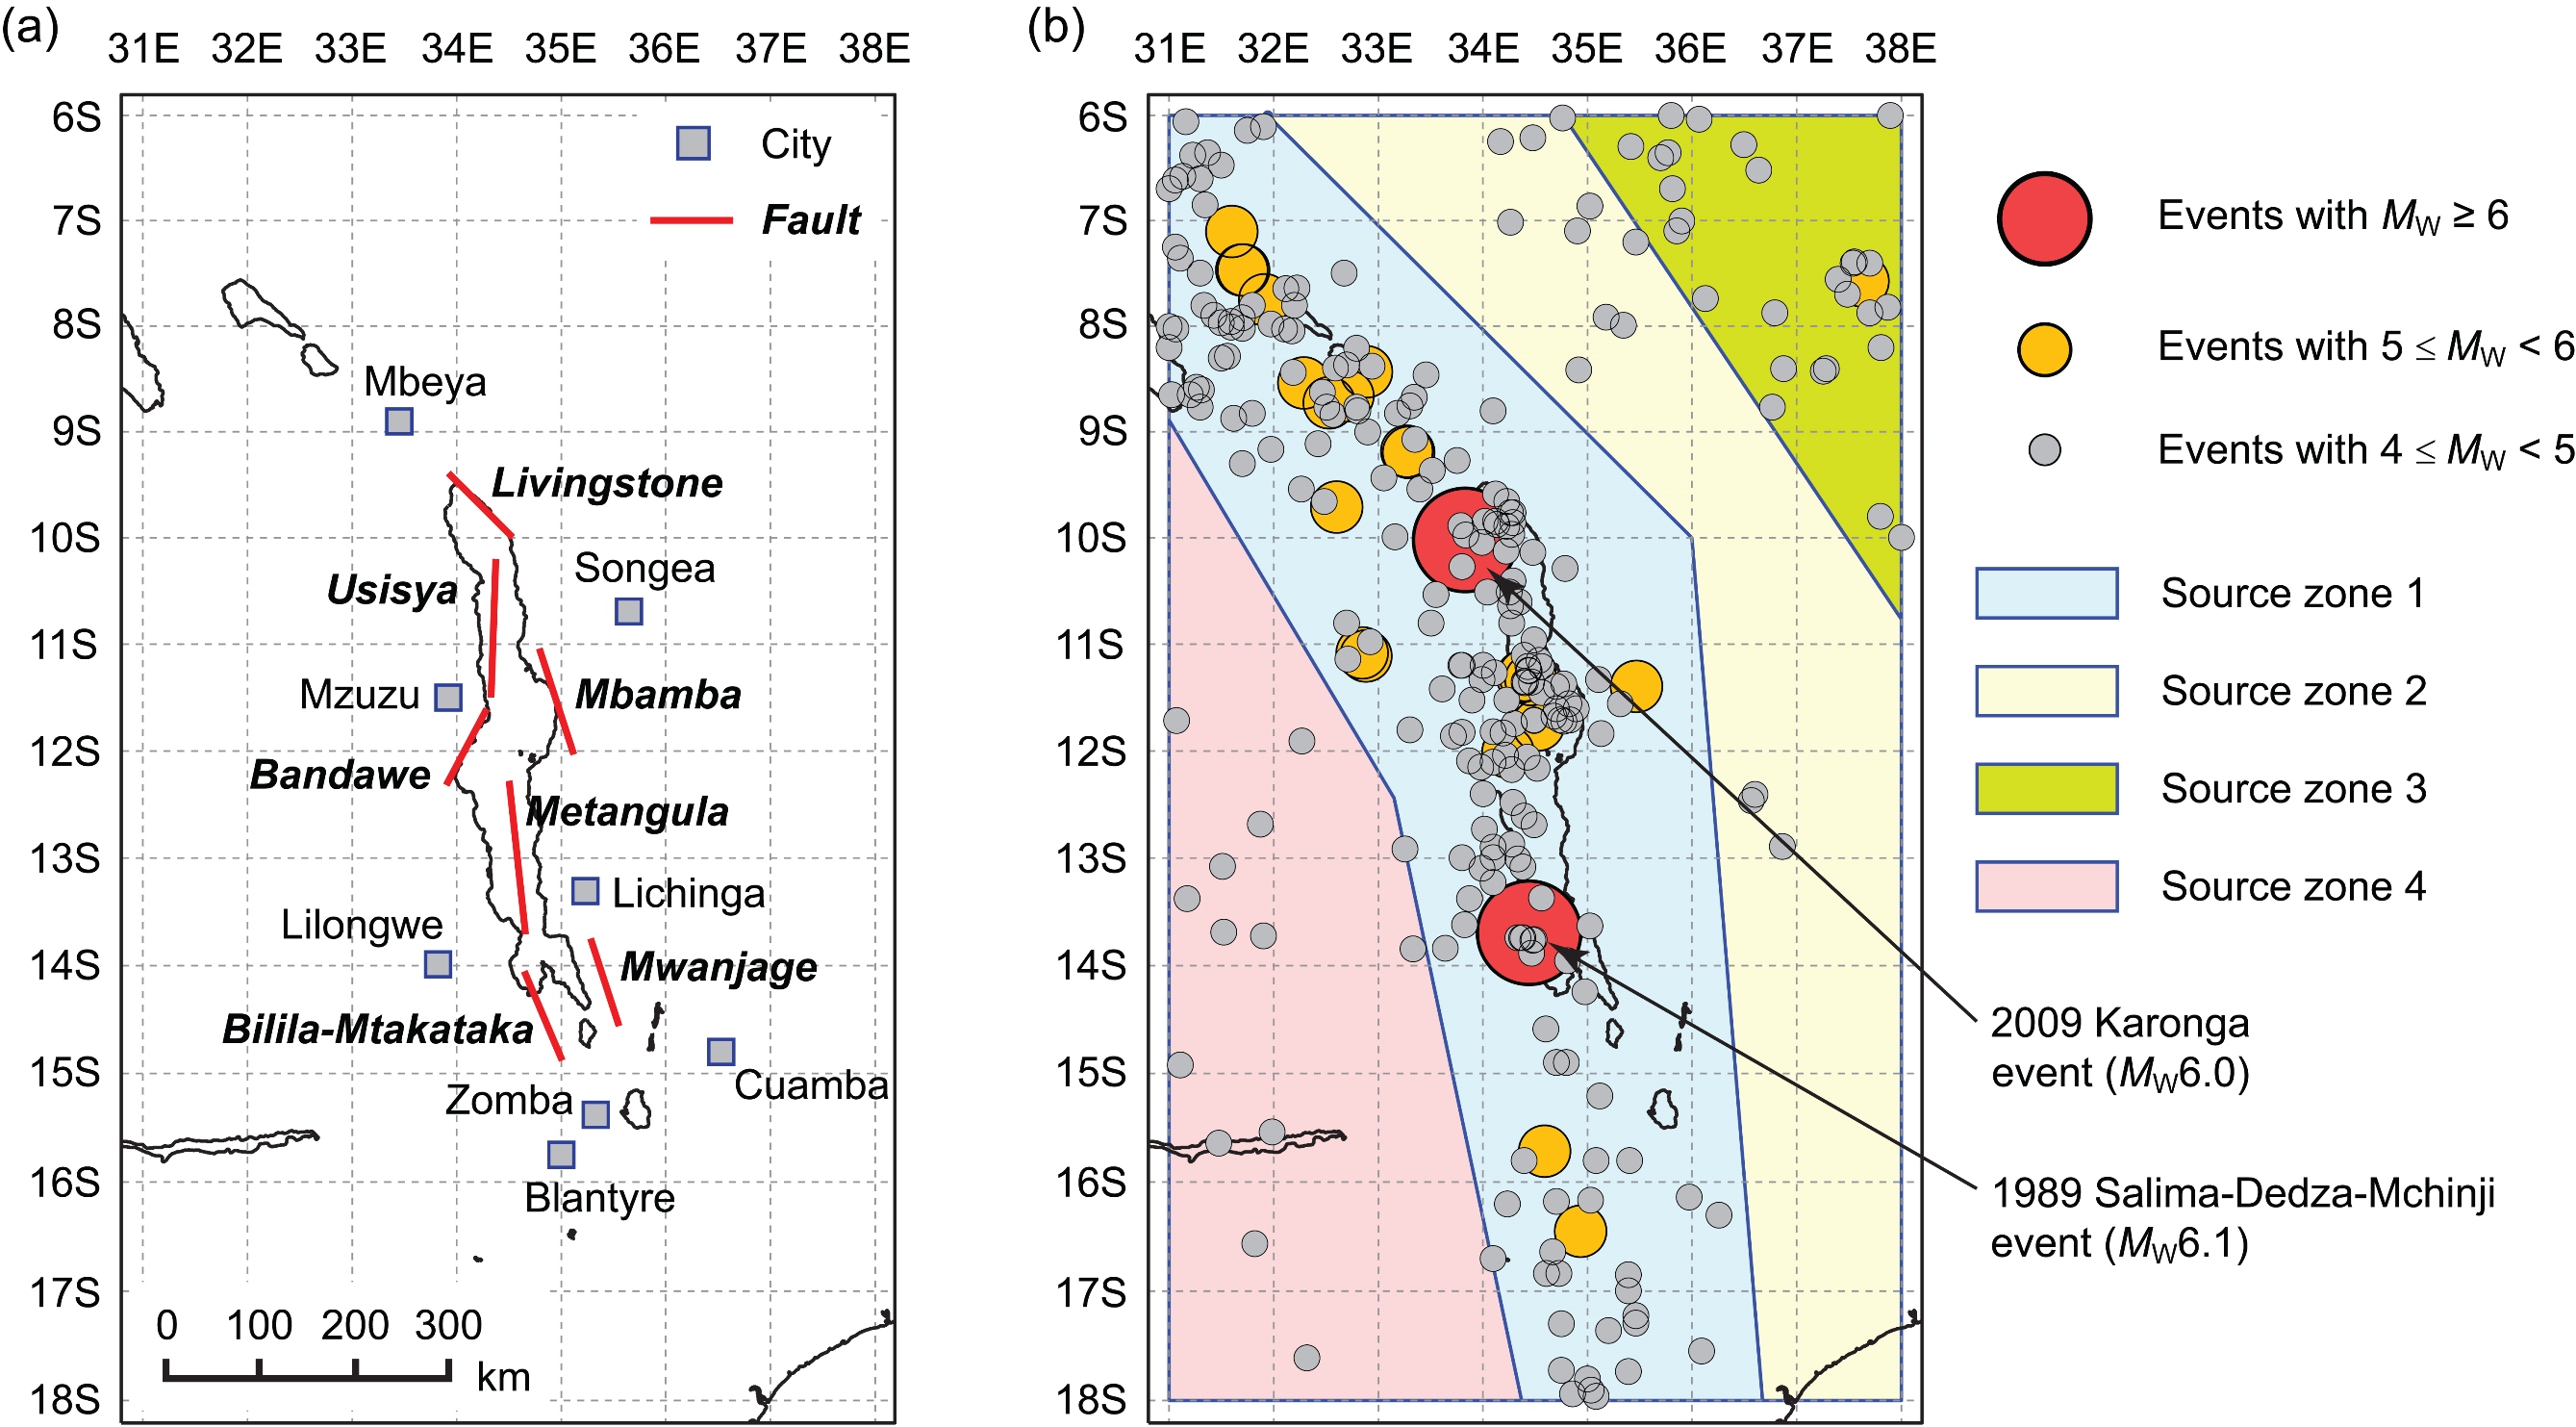
The East African Rift system is situated at the plate boundary between the Somalian and Nubian Plates, and extends over 4,000 km from the triple junction in Afar to fault-controlled basins in Malawi and south through Mozambique. The Malawi Rift lies on the southern branch of the East African Rift system and extends from Rungwe in the north to the Urema graben in the south. Relatively long fault lengths (>90 km) and wide seismogenic thickness (>30 km) in the Malawi Rift system suggest that earthquakes of M7.0 or greater are possible. For East Africa, a seismic hazard study conducted as part of the Global Seismic Hazard Assessment Programme (GSHAP) applied a conventional PSHA methodology by considering an available instrumental catalogue only. However, geomorphological evidence in the Malawi Rift indicates strongly potential for hosting characteristic earthquakes up to M8. Therefore, the current regional seismic hazard assessment may be significantly incomplete.

To address these issues, we explored the differences between the Gutenberg-Richter and characteristic earthquake models in the light of the geomorphological evidence for large events, taking account of uncertainties in fault dimensions, orientations, and segmentation to generate a synthetic source catalogue. Moreover, we investigated the impact of incorporating geomorphological information on the PSHA results for several cities around Lake Malawi by producing regional seismic hazard contour maps, uniform hazard spectra, and seismic disaggregation plots based on both instrumental and extended earthquake catalogues. In particular, we compared the seismic hazard results for (a) different earthquake catalogues (instrumental catalogue, continuous rupture catalogue, segmented rupture catalogue, and mixed rupture catalogue), (b) different return periods (500, 1,000, and 2,500 years), and (c) different ground motion parameters (peak ground acceleration and spectral accelerations at different vibration periods). We also tested the sensitivity of our results to the basic assumptions such as: the characteristic earthquake model, the chosen scaling relationships, fault segmentation, and neglecting any aseismic contribution to plate motion.

E-quakes small

REFERENCES

Hodge, M., Biggs, J., Goda, K. and Aspinall, W. (2015). Assessing infrequent large earthquakes using geomorphology and geodesy: the Malawi Rift. Natural Hazards, 76(3). http://link.springer.com/article/10.1007%2Fs11069-014-1572-y

Case Study 6: Reducing uncertainty in streamflow predictions using reverse hydrology

Ann Kretzschmar, Lancaster University

Keith Beven, Lancaster University

DOWNLOAD

THE CHALLENGE

The modelling of environmental processes is subject to a high degree of uncertainty due to the presence of random errors and a lack of knowledge about how physical processes operate at the scale of interest.  Use of uncertain data when identifying and calibrating a model can result in uncertain parameter estimation and ambiguity in the outcomes.  Rainfall-runoff modelling, where a single rain-gauge is often assumed to be representative of the potentially highly variable (in both space and time) rainfall field, is a good example. Instead, we apply a novel method for inferring ‘true’ catchment rainfall from streamflow (so-called ‘reverse hydrology’), highlighting that streamflow is better estimated using inferred rainfall than observed rainfall (from a single gauge) because a single gauge gives only a partial description of the rainfall field.

WHAT WAS ACHIEVED

Reverse hydrology utilises the information in the streamflow exiting the catchment to infer the rain that has fallen over the whole catchment rather than the amount measured at an individual rain gauge. The latter may not be representative of the total rainfall field and may even lead to spurious spikes in the modelled flow where rain has been measured at the gauge but not elsewhere in the catchment. This technique could deliver an improved estimate of the total rainfall. Indeed, reverse hydrology could be an important tool in developing our understanding of catchment rainfall distribution, and the processes by which it is converted into streamflow, leading to a reduction in uncertainty and an improvement of future flow predictions that might result in saved lives, reduced damage to property and infrastructure, and ultimately to decreased costs.

HOW WE DID IT

Models were identified using the observed rainfall series for individual gauges drawn from a set of 23 gauges and the catchment outflow. The model was then inverted using the regularisation method. In order to compare the inferred and observed rainfall sequences and determine the time resolution of the inferred sequence, aggregation by sub-sampling at increasing sampling intervals was performed. Nash-Sutcliffe Efficiency (Rt2) was calculated at each interval, and the time interval with the closest fit to the observed (aggregated) rainfall (highest Rt2) was taken to be the time resolution of the inferred rainfall.  The Rt2 of the aggregated sequence was compared with the Rt2 of the fitted indicating that, despite the loss of time-resolution, the results are closely comparable. For all gauges, the aggregation period (estimate of time resolution) of the inferred rainfall sequence is less than the value of the model’s fast time constant, implying that the catchment dynamics are being captured. Flow was generated using the inferred rainfall sequence from each individual gauge. The resulting flow sequences were found to more closely match the observed flow (typically Rt2 = 0.996) than flows generated from models fitted to individual gauges (Rt2 = 0.804 to 0.831) or flow generated from a model fitted using the catchment average rainfall calculated from 23 gauges using the Thiessen Polygon method (Rt2 = 0.852).

REFERENCES

Ann Kretzschmar, Wlodek Tych, Nick Chappell, Keith Beven What really happens at the end of the rainbow? – paying the price for reducing uncertainty (using reverse hydrology models) 12th International Conference on Hydroinformatics, HIC 2016. Procedia Engineering (in press)

Kretzschmar, A., Tych, W., Chappell, N.A. and Beven, K.J., 2015. Reversing hydrology: quantifying the temporal aggregation effect of catchment rainfall estimation using sub-hourly data. Hydrology Research, p.nh2015076.

Case Study 5: Dealing with the implications of climate change for landslide risk

Susana Almeida, University of Bristol

Elizabeth Holcombe, University of Bristol

Francesca Pianosi, University of Bristol

Thorsten Wagener, University of Bristol

DOWNLOAD

THE CHALLENGE

Landslides have large negative economic and societal impacts, including loss of life and damage to infrastructure. Management of landslide risks takes place in the presence of high levels of uncertainty about the drivers of slope failure, including slope properties and precipitation patterns. Future climate change is expected to further exacerbate these challenges due to the high-levels of uncertainty about how changes in global climate will affect local-level precipitation dynamics. A critical challenge, therefore, is to produce information in support of landslide management in the face of these large uncertainties.

WHAT WAS ACHIEVED

We developed a generic methodology to evaluate the impacts of uncertainty about slope physical properties and future climate change on predictions of landslide occurrence.

We tested the methodology for a case study in the Caribbean (Fig. 1). Our key finding for the study region is that slope properties could be a more important driver of landslide occurrence than uncertain future climate change. This suggests that failure to account for both sources of uncertainty may lead to underestimation of landslide hazards and associated impacts on society.

Our methodology provides a valuable tool to identify the dominant drivers of slope instability, and the critical thresholds at which slope failure will occur. This information can help decision-makers to target data acquisition to improve predictability of landslide occurrence, and also supports development of policy (e.g. improving slope drainage, restricting development in high-risk areas) to reduce the occurrence and impacts of landslides.

HOW WE DID IT

Climate change is highly uncertain and difficult to predict. In this study, we therefore sought to identify what level of climate change will lead to slope failure. Using a numerical slope stability model, we evaluated the risk of slope failure for a wide range of potential slope properties and future rainfall conditions. We then applied statistical algorithms to determine the critical threshold slope and rainfall properties at which slope failure will occur. The resulting outputs are visualised in the form of decision-trees. A key advantage of this approach is that new information about future climate (e.g. from improved climate models) can be easily incorporated to assess the plausibility of slope failure occurring. This information can be used to support decision maker discussions on whether improved management is required to improve slope stability in the future.

landslide pic

Figure 1 – Typical informal housing on a landslide-prone slope in the Eastern Caribbean (photograph by Holcombe, 2007)

REFERENCES

Almeida, S., Holcombe, E., Pianosi, F. and Wagener, T., Dealing with deep uncertainties in landslide modelling for urban disaster risk reduction under climate change. Natural Hazards and Earth System Sciences (in preparation)

Case Study 4: Next-generation lahar (volcanic mudflow) models built on uncertainty analysis

Jeremy Phillips, University of Bristol

Mark Woodhouse, University of Bristol

Andrew Hogg, University of Bristol

DOWNLOAD

THE CHALLENGE

Lahars (volcanic mudflows) are high-speed mixtures of volcanic materials and water that result from volcanic eruptions on ice-capped volcanoes or rainfall remobilisation of volcanic ash deposits. The largest flows can travel for up to a few hundred km from their source, and the single most deadly volcanic event in the last century was the Nevado del Ruiz (Colombia) lahar in 1985 that destroyed the town of Armero killing 23,500 people. The dynamics of lahars are very strongly dependent on the topography over which they flow, and they often occur in countries where topographic maps cannot be obtained at high resolution. Furthermore, the flow conditions within lahars are complex and highly variable, and cannot yet be fully described in models. The predominant challenge to developing a predictive model for lahar flow is to achieve an efficient trade-off between the level of detail needed to adequately describe the topography and the incomplete knowledge of the physics of the flow conditions. Analysis of the uncertainty in the model predictions arising from these sources enabled us to address this challenge.

WHAT WAS ACHIEVED

We have developed a new dynamic model for lahar hazard where the model is tuned so that the uncertainty in the model formulation is consistent with the uncertainty in its input conditions, and where the uncertainty on the model predictions is known. This represents a critical advance in being able to assess lahar hazard at large spatial scales, and communicate the level of confidence in the model predictions to risk managers and stakeholders. The model predicts the footprint of the flow, and the time taken for the flow to reach important locations, providing important new information for preparedness against lahar threat. The model is being used for lahar hazard assessment in Colombia and Ecuador and will be available to the natural hazard community worldwide via a web interface.

HOW WE DID IT

Uncertainties in lahar models primarily arise from the inability of the equations used to completely describe the behaviour of the full-scale flow (structural uncertainty), imperfect knowledge of the starting conditions of the flow and the topography over which the flow is travelling (input uncertainty), and uncertainties in measurements of full-scale flows with which the model is being compared (observational uncertainty). We have used a method for examining the structural uncertainty in models (‘history matching’; Vernon et al 2010) that identifies those model inputs that produce outputs which are consistent with uncertain measurements of the full-scale flow, incorporating the input and observational uncertainty. The resulting model is based on the physics of the flow of high concentration particle suspensions on topography, including descriptions of how the flow erodes underlying substrate on steeper slopes and deposits particles on shallower slopes. A key component is a new scheme for implementing the model on coarse resolution topography at a scale consistent with other model uncertainties.

lahar pic

Lahar flow from Mt Ruapehu, New Zealand, 2007 (courtesy V. Manville)

REFERENCES

Vernon I, Goldstein M, Bower RG (2010) Galaxy formation: a Bayesian uncertainty analysis. Bayesian Anal 5(4):619–669. doi:10.1214/10-BA524

Case Study 3: Using weather forecasts to optimally issue severe weather warnings

Theo Economou, University of Exeter

David Stephenson, University of Exeter

Ken Mylne, Met Office

Rob Neal, Met Office

Weather forecasts and warnings are only useful if people use them to make decisions which help to protect lives, livelihoods and property. As forecasts become more sophisticated and include information on probability and risk they are potentially more valuable, but interpretation needs to be tailored to the vulnerabilities of particular decision-makers. This project has significantly advanced our capability to apply this in the field of severe weather warnings and opens the possibility of warnings tailored to the needs of individual users. Ken Mylne, Met Office

DOWNLOAD

THE CHALLENGE

Warning systems play a major role in reducing economic, structural and human losses from natural hazards such as windstorms and floods.

A weather warning system is a tool by which imperfect forecasts about the future are combined with potential consequences to produce a warning in a way that is deemed optimal. A warning system is only useful if well defined and thus understood by stakeholders. The challenge here was to improve the current severe weather warning system used by the UK Met Office, which uses traffic-light colours based on a likelihood-impact matrix illustrated below, by making it more transparent and tailored for the various end-users.

pic 1 pic 2

Weather impact matrix used in the National Severe Weather Warning Service, and a sample of automatically-generated warning colours using ensemble weather forecast data to help guide forecasters in the issue of warnings

WHAT WAS ACHIEVED

Based on sound mathematical theory, we produced a tool that combines predictions of future weather with user-attitude towards false alarms/missed events to produce bespoke warnings that are optimal for each user.

Below are examples of rainfall warnings during 15-31 October 2013 for two such users: 1) an end-user who is tolerant towards false alarms (left), and 2) a forecaster who issues warnings and thus less happy about false alarms as they might affect their credibility (right). There are 4 increasing levels of warnings: green, yellow, amber and red, and 4 rainfall intensity categories: very low, low, medium and high. The height of the bars indicates the forecasted rainfall intensity (1 for no rainfall, 8 for high rainfall) whereas the symbols at top of each bar indicate what actually happened. Clearly the end-user and the forecaster have very different views about what warnings they want to see, which is what our framework is designed for: bespoke warnings to all end-users, with minimal user input regarding false-alarm appetite.

pic 3 pic 4

The method developed is being implemented as a trial demonstrator at the Met Office using live forecast data. Below is an example of a heavy rainfall warning issued on 11 Aug 2016, together with three automated first-guess warnings based on different loss functions as described above.

pic 6pic 5pic 7

Case Study 2: Forecasting volcanic ash transport using satellite imagery and dispersion modelling

Kate L. Wilkins (University of Bristol)

Matt Watson (University of Bristol)

Helen Webster & Dave Thomson (Met Office)

Helen Dacre (University of Reading)

DOWNLOAD

THE CHALLENGE

Volcanic eruptions are complex processes that can eject millions of tonnes of ash into the atmosphere. The 2010 eruption of Eyjafjallajökull, Iceland, showed that volcanic ash can cause disruption to global transport, but forecasting the dispersion of ash is non-trivial. Elements of the source term required by dispersion models, such as the eruption rate and plume height, can be highly uncertain, leading to significant uncertainty in the concentration and location of ash downwind. Data assimilation methods aim to constrain some of those uncertainties by incorporating observations into the modelling framework, but the complex algorithms often require some estimation of the source term. The work undertaken during this PhD project focused on data insertion, where an observation was used to initialise a transport model downwind of the vent, and investigated whether near-source processes that complicate ash simulations could be by-passed.

HOW WE DID IT

First, a proof of concept was set out with some initial experiments1, where a series of satellite retrievals from different times (estimations of the physical properties of the ash cloud from satellite data) were used to initialise the Met Office NAME dispersion model. A forecast was created from the simulations, which compared well against observations. Next, the proof of concept was taken forward into a full case study2, where different configurations of the method were quantitatively and qualitatively evaluated against observations and other modelling methods. In the next piece of work3, the method was extended to sequentially update ash forecasts with volcanic ash retrievals and a clear/cloud/ash atmospheric classification scheme. These forecasts were evaluated against satellite data, ground mass ash concentration estimates and particle size measurements to determine optimal configurations of the scheme.

WHAT WAS ACHIEVED

Two methodologies were developed, one simple and one more complex. The case studies have shown that, as long as good satellite observations of the ash cloud are available, it is possible to create dispersion forecasts that compare well against observations without the need to estimate the effects of some of the processes that occur close to the vent. These include the fraction of fine ash that survives near-source fall out and the ash eruption rate. However, data insertion is unlikely to work well if much of the ash is obscured from the sensor, unless ash is also released from the vent during the model run. Some elements of the downwind source, such as the vertical distribution of the ash layer, particle size distribution and particle density, may still need to be estimated in cases where observations are not available.

Pic

Figure 1 Plume erupting from the Santiaguito volcano, Guatemala. Photo: K. Wilkins

REFERENCES

1Wilkins KL, Mackie S, Watson IM, Webster HN, Thomson DJ, Dacre HF. Data insertion in volcanic ash cloud forecasting. Ann Geophys. 2014;57(2):1-6. doi:10.4401/ag-6624.

2Wilkins KL, Watson IM, Kristiansen NI, et al. Using data insertion with the NAME model to simulate the 8 May 2010 Eyjafjallajökull volcanic ash cloud. J Geophys Res Atmos. 2016;121:306–323. doi:10.1002/2015JD023895.

3Wilkins KL, Western LM, Watson IM. Simulating atmospheric transport of the 2011 Grimsvotn ash cloud using a data insertion update scheme. Atmos Environ. 2016;141:48-59. doi:10.1016/j.atmosenv.2016.06.045.

CASE Study 1: Real-time forecasting of algal bloom risk for lakes and reservoirs

Trevor Page, Paul Smith, Keith Beven (Lancaster University)

Ian Jones, Alex Elliott, Stephen Maberly (CEH)

DOWNLOAD

THE CHALLENGE

Algal blooms are a significant problem for water resources worldwide, estimated to cost more than £50 million per year in the UK.  Some species of algae (e.g. cyanobacteria; more commonly known as blue-green algae) can produce toxins that can be harmful to people and animals, making waterbodies unsafe for recreational activities and as a drinking water resource. These harmful algal blooms most often occur in nutrient-rich waters, particularly during warm, calm weather, and are predicted to increase under a changing climate. Closure of recreational waters and water resource mitigation strategies are inconvenient and costly.  It is therefore an advantage to have an early-warning system to be able to implement the most cost-effective management strategies.

WHAT WAS ACHIEVED

A real-time algal bloom forecasting system was developed1,2,3 providing up to 10 day ahead forecasts.  The system used high-frequency in-lake observations, ECMWF weather forecasts and a computer model to provide estimates of how a lake algal community is likely to change over the forecast period.  Importantly the computer model includes species-level algal estimates as only specific species of algae produce toxins. This work demonstrated that algal forecasting is feasible, that real-time high frequency data are critical to improve forecasting accuracy and in reducing uncertainty. The requirement and cost-effectiveness of such a system has been assessed under a NERC Pathfinder project1 which identified that there is currently a move within the water industry towards the use of real-time data to inform decision making, and that the algal forecasting system could provide another step towards development of this “intelligent network”.  The tool was shown to be cost effective for specific “problem” water bodies, and that cost-effectiveness would be far higher if wider societal benefits, such as recreational access, knock-on effects on local businesses and willingness to pay versus willingness to accept algal blooms, were taken into account.

HOW WE DID IT

The system (Figure 1) development was based around the modification of an algal community model PROTECH (Reynolds et al., 2001) to allow it to utilise high frequency data, collected from buoys deployed onto lakes across the UK2, to improve forecasts. The physical (i.e. non-biological) part of the model was simplified as a way of increasing its speed in order to allow better representation of forecast uncertainties. This simplification also allowed better utilization of real-time buoy data whilst retaining the important biological parts necessary to provide species level forecasts. The weather forecasts used to drive the model required modification for specific lakes (a “downscaling” procedure) and rainfall forecasts were used to drive a very simple hydrological model which estimated what the inflows to the lake would be for the forecast period. Inflows were associated with nutrient inputs to the lake which are a critical and particularly challenging part of the forecasting jigsaw.

Figure 1a Figure 2aFigure 1 (a) Forecasting system components; (b) example of concatenated 10 day ahead forecast

REFERENCES

1 NERC Pathfinder Grant NE/N004817/1

2 NERC UKLEON project (http://www.ecn.ac.uk/what-we-do/science/projects/ukleon)

3 NERC, PURE, CREDIBLE (Consortium on Risk in the Environment: Diagnostics, Integration, Benchmarking, Learning and Elicitation) Project.

PURE Showcase Event

Join CREDIBLE, RACER and the PURE KE Network for the NERC PURE final showcase, which will take place on Tuesday 13th September 2016 at the Natural History Museum, London.

The Probability, Uncertainty and Risk in the Environment (PURE) Knowledge Exchange Network and Research Programme were established in 2012 and are funded by NERC. Since its inception, PURE has facilitated a wide variety of activities and collaborations. After four successful years, PURE will draw to a close in 2016.

The day aims to celebrate the highlights of the PURE Research Programme and encourage future collaborations. The presentations will feature a variety of projects enabled by PURE.

Click here to see the agenda for the day. Sir Mark Walport, Government Chief Scientific Adviser, will give the opening address and the programme will include presentations on a variety of tools that have been developed to improve our understanding of natural hazard risks, predictions and modelling.

Please RSVP to pureshowcase@smithinst.co.uk by Friday 15th July if you would like to attend, indicating if you have any special dietary requirements.

Risk and Uncertainty Summer School 2016

The school will provide advanced training in risk and uncertainty in natural hazards from some of the UK’s leading academics. Afternoons will include practical sessions and hands-on exercises.  The school is open to postgraduates, early career researchers and scientists from industry and government agencies.

Registration

Register here. Please note that there are limited spaces so we recommend booking early to avoid disappointment.  Registration closes on Monday 27 June.

Confirmed lecturers and subjects

Calibrate your model – Dr Jonty Rougier

In this session we explore the principles of model calibration, and simple tools for the same: space-filling designs (eg latin hypercubes), visualisation with parallel coordinate plots, dealing with multivariate outputs (principal variables analysis), ruling out regions of parameter space (history matching), proceeding sequentially.

Sensitivity analysis – Professor Thorsten Wagener

Sensitivity analysis investigates how the uncertainty in the model output can be apportioned to the uncertainty in the model input (including its parameters). We will introduce the most widely used approaches to sensitivity analysis and provide hands-on applications of these methods to natural hazard models of varying complexity.

Expert elicitation – Dr Henry Odbert (with Professor Willy Aspinall)

This session covers background to the use of scientific experts’ opinions in decision support; concept of Cooke’s Classical Model for determining performance-based weights and differential pooling of opinions from a group of experts, with strong emphasis on the expression of uncertainty estimates; principles for obtaining a “rational consensus”. Also described will be a complementary approach for eliciting qualitative rankings and preferences by a paired comparison approach coupled with probabilistic inversion to produce ranking metrics and consistency checks.

Decision analysis – Dr Theo Economou 

When trying to fit statistical models for inferential purposes, we may conclude that there is not enough data to actually implement a model. In decision making however, decisions have to be made regardless of the amount or quality of the available information. This session introduces Bayesian decision analysis which offers a coherent framework for making decisions under uncertainty. The framework is illustrated using the example of issuing hazard warnings, followed by an R practical session.

Venue

The summer school will be held at Engineers House, a Grade II listed building in Clifton Down, a prestigious suburb of Bristol.

Directions, travel and parking.

Fees

Postgraduate students: £300

Non-students: £500

The cost includes all course materials & lunch and your place on the course for the week.

Accommodation is not provided but we have a Summer School accommodation list (PDF, 200kB). Please note the University does not endorse these venues.

Summer School 2015

Places are still available for this year’s summer school on risk and uncertainty in in natural hazards.

Topics include:

  • Sensitivity analysis
  • Expert elicitation
  • Calibrating your model
  • Decision analysis
  • Bayesian Belief Networks

The school is open to postgraduates, early career researchers, scientists and practitioners from industry and government agencies.

Students £300, non-students £500

Delivered by the Cabot Institute and NERC CREDIBLE

Further information: http://www.bris.ac.uk/cabot/events/2015/520.html