Kate L. Wilkins (University of Bristol)
Matt Watson (University of Bristol)
Helen Webster & Dave Thomson (Met Office)
Helen Dacre (University of Reading)
DOWNLOAD
THE CHALLENGE
Volcanic eruptions are complex processes that can eject millions of tonnes of ash into the atmosphere. The 2010 eruption of Eyjafjallajökull, Iceland, showed that volcanic ash can cause disruption to global transport, but forecasting the dispersion of ash is non-trivial. Elements of the source term required by dispersion models, such as the eruption rate and plume height, can be highly uncertain, leading to significant uncertainty in the concentration and location of ash downwind. Data assimilation methods aim to constrain some of those uncertainties by incorporating observations into the modelling framework, but the complex algorithms often require some estimation of the source term. The work undertaken during this PhD project focused on data insertion, where an observation was used to initialise a transport model downwind of the vent, and investigated whether near-source processes that complicate ash simulations could be by-passed.
HOW WE DID IT
First, a proof of concept was set out with some initial experiments1, where a series of satellite retrievals from different times (estimations of the physical properties of the ash cloud from satellite data) were used to initialise the Met Office NAME dispersion model. A forecast was created from the simulations, which compared well against observations. Next, the proof of concept was taken forward into a full case study2, where different configurations of the method were quantitatively and qualitatively evaluated against observations and other modelling methods. In the next piece of work3, the method was extended to sequentially update ash forecasts with volcanic ash retrievals and a clear/cloud/ash atmospheric classification scheme. These forecasts were evaluated against satellite data, ground mass ash concentration estimates and particle size measurements to determine optimal configurations of the scheme.
WHAT WAS ACHIEVED
Two methodologies were developed, one simple and one more complex. The case studies have shown that, as long as good satellite observations of the ash cloud are available, it is possible to create dispersion forecasts that compare well against observations without the need to estimate the effects of some of the processes that occur close to the vent. These include the fraction of fine ash that survives near-source fall out and the ash eruption rate. However, data insertion is unlikely to work well if much of the ash is obscured from the sensor, unless ash is also released from the vent during the model run. Some elements of the downwind source, such as the vertical distribution of the ash layer, particle size distribution and particle density, may still need to be estimated in cases where observations are not available.
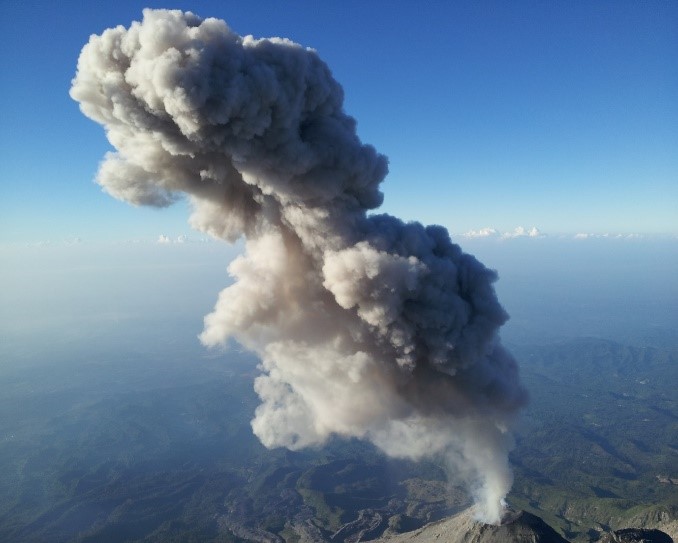
Figure 1 Plume erupting from the Santiaguito volcano, Guatemala. Photo: K. Wilkins
REFERENCES
1Wilkins KL, Mackie S, Watson IM, Webster HN, Thomson DJ, Dacre HF. Data insertion in volcanic ash cloud forecasting. Ann Geophys. 2014;57(2):1-6. doi:10.4401/ag-6624.
2Wilkins KL, Watson IM, Kristiansen NI, et al. Using data insertion with the NAME model to simulate the 8 May 2010 Eyjafjallajökull volcanic ash cloud. J Geophys Res Atmos. 2016;121:306–323. doi:10.1002/2015JD023895.
3Wilkins KL, Western LM, Watson IM. Simulating atmospheric transport of the 2011 Grimsvotn ash cloud using a data insertion update scheme. Atmos Environ. 2016;141:48-59. doi:10.1016/j.atmosenv.2016.06.045.