Barnaby Dobson, University of Bristol
Jolyon Miles-Wilson, University of Bristol
Iain Gilchrist, University of Bristol
David Leslie, Lancaster University
Thorsten Wagener, University of Bristol
DOWNLOAD
THE CHALLENGE
Stakeholder consideration is becoming an increasingly important issue in flood risk management, which leads to a requirement for understanding how information on flood risk is interpreted and used for decision-making. The need for improved public awareness regarding flood hazards is also becoming increasingly evident, especially in the context of the ongoing debate on the potential impacts of climate change. Researchers and governmental bodies currently emphasise the need of publicly available flood risk information on which individuals can base appropriate flood mitigation strategies.
While there is increasing recognition of the need for public consideration, actual quantitative investigations into human behaviour related to using flood risk information are still limited. Within this context, a much recommended but little explored question is how to communicate flood risk information to members of the public so that they can make informed decisions.
WHAT WAS ACHIEVED
Our key finding is that the visual format of flood-risk information influences risk perception when presented to members of the public. We observed that viewers found it more difficult to distinguish different levels of flood risk when presented with maps than when the same information was presented in graphical or tabulated form. Feedback from participants in our study suggested that the reason for this difficulty was that maps were hardest to use. This outcome is particularly relevant for flood-risk communicators in countries that currently employ flood hazard maps as their primary method for communication. When presenting information to the public they may wish to carefully consider their audience and intended message; maps are useful to planners interested in large areas, but individuals find it hard to extract the more specific information they need.
Our findings also showed that the presence of flood risk information influences decision making in the context of house purchasing. We found that buyers became less likely to purchase a house if it was associated with a higher risk of flooding. Our study suggests that buyers are interested in the flood risk for the houses they considering purchasing if that risk is significant.
HOW WE DID IT
Our study was based on examining the response of participants to different types of flood risk visualization provided in the context of selecting a property to purchase. Participants were selected on the basis of being either previous home buyers or actively seeking to purchase a home at the time of testing.
We compared three ways of presenting the same flood risk information: (i) the map format of presentation currently used by the UK Environment Agency, (ii) a table format, similar to the well-known energy rating labels, that presents flood depth information in combination with flood frequency information, and (iii) a graphical representation depicting the depth-frequency combination using a sketch house image as a physical referent.
During the experiment participants were presented with a computer screen with a series of trials in which information about two houses was presented side by side. Participants were asked to make a forced choice preference judgement between these pairs of houses to indicate which house they would consider purchasing.
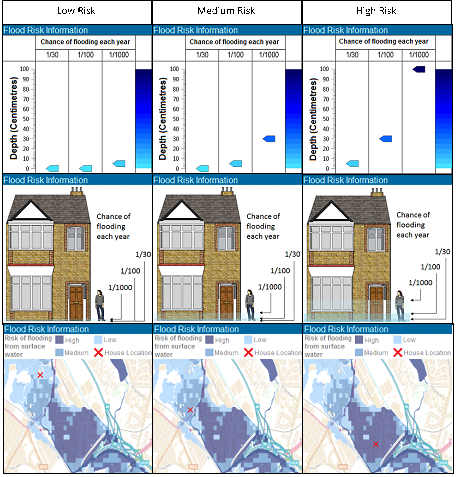
The three ways of presenting the flood risk information that were used on the real estate pages: Table (top row); Graphic (middle row) and Map (bottom row) for three levels of risk: Low Risk (first column); Medium Risk (second column); High Risk (third column).