Laura Dawkins, University or Exeter
David Stephenson, University of Exeter
Ken Mylne, Met Office
DOWNLOAD
The Challenge
Windstorms are the 2nd largest cause of global insured loss and are a major contributor to losses in Europe. Extreme, damaging European windstorms have differing characteristics. Some cover a large area reaching relatively low wind gust speeds, while others cover a smaller area reaching much higher wind gust speeds. A better understanding of the relative damage caused by the spatial and intensity characteristics of a windstorm is therefore required. Key Question: Which windstorm footprint characteristics are most damaging?
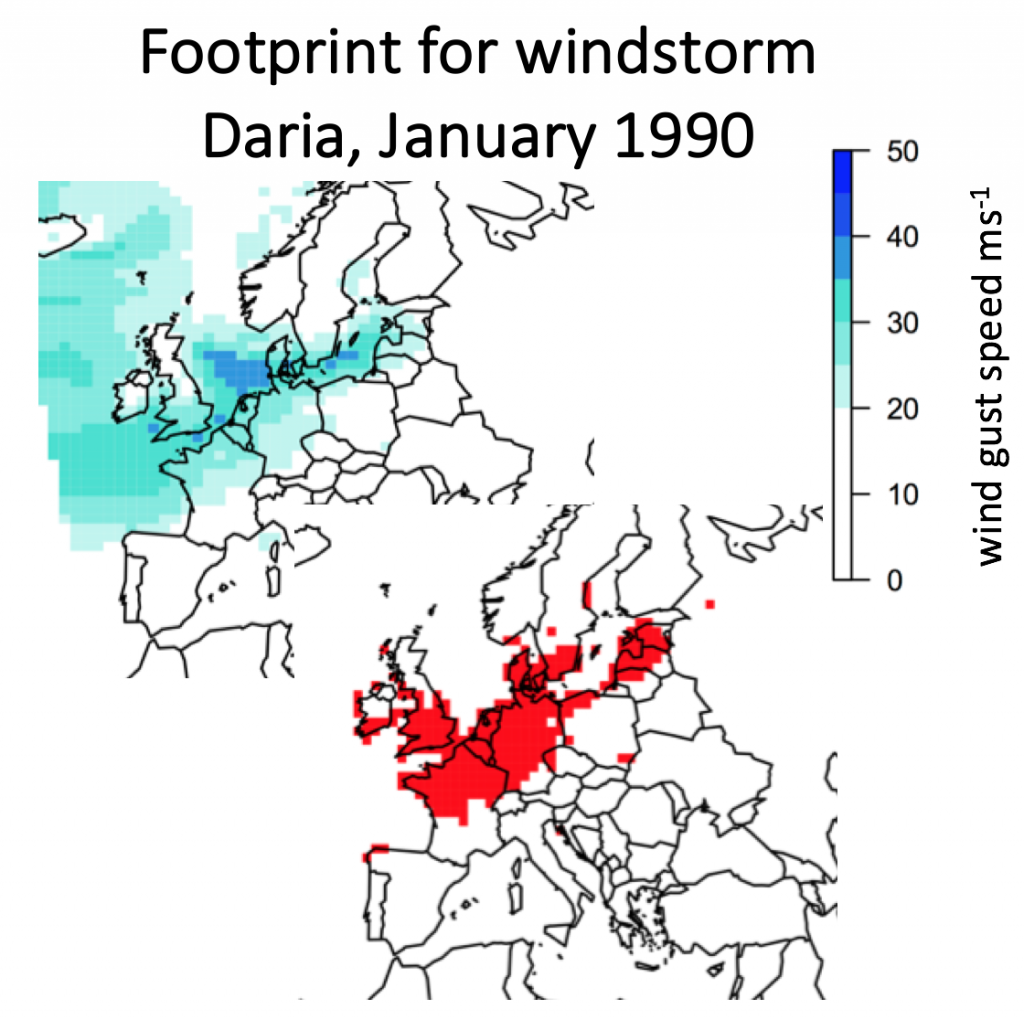
The severity of a windstorm hazard event is often summarised in terms of its footprint, defined as the maximum wind gust speed to occur at a set of spatial locations over the duration of the storm. This project aimed to develop and critically apply a statistical methodology to explore the relationship between windstorm footprint characteristics and insured loss to address this question. This improved understanding will be used to help explain the surprising decline in windstorm related insured losses in the 21st century, previously identified by both academics and insurers.
What We Have Achieved
A better understanding of the influence of windstorm footprint characteristics on insured loss has been achieved. The local intensity characteristics of the footprint have been shown to have more effect on insured loss than the spatial dependence structure characteristics. The local intensity was shown to have decreased in the 21st century, related to a change in the North Atlantic Oscillation, a large scale atmospheric mode of variability.
This insight involved the development of a novel geostatistical windstorm hazard footprint model. The project involved a unique application of the sensitivity analysis method developed within the CREDIBLE project to this complex stochastic hazard model. This provides an important example for future users of this method.
This statistical windstorm footprint hazard model allows for fast simulation of realistic synthetic windstorm footprints (~3 seconds on a standard laptop). This simulation speed could be very effectively utilised to explore windstorm risk, for example in the insurance industry, where currently much slower atmospheric models are used to create synthetic windstorm footprints. Future planned applications of the statistical footprint model will involve working with the insurance industry and the Met Office.
How We Did It
This project benefited from a recent large data set of 5730 regionally downscaled historical windstorm footprints from winters (October-March) 1979-2012 (kindly modelled by J. Standen and provided by J. Roberts of the Met Office). The investigation was carried out in three stages:
(1) Firstly, a number of storm severity measures, functions of extreme footprint wind gust speeds which represent multiple characteristics of the footprint, were developed based on existing measures in the literature, to explore which best represent European wide insured loss.
(2) Secondly, a spatial geostatistical model for windstorm footprints was developed for the whole European domain with 3 parameters for the wind intensity (1-3) and 3 for the footprint spatial dependence structure (4-6). This model was used to produce synthetic footprints with varying characteristics, which were used in a PAWN sensitivity analysis study (Pianosi and Wagener, 2015) to explore which characteristics have most influence on insured loss, approximated by the footprint damage area.
(3) Lastly, the damage area of historical storms was compared to the North Atlantic Oscillation phase to explore the reasons for the 21st century decline in windstorm related losses (more detail in Dawkins et. al, 2016).
References
Dawkins, L. C., Stephenson, D. B., Lockwood, J. F., and Maisey, P. E.: The 21st Century Decline in Damaging European Windstorms, Natural Hazards Earth System Sciences Discussion, in review, 2016
Pianosi, F & Wagener, T, 2015, ‘A simple and efficient method for global sensitivity analysis based on cumulative distribution functions’. Environmental Modelling and Software, vol 67., pp. 1-11
