CREDIBLE Case Studies

Some of the highlights from the CREDIBLE project are now available to download in a series of case studies:

A tool for understanding and quantifying model uncertainty: Sensitivity Analysis for Everyone (SAFE)

Dealing with the implications of climate change for landslide risk

European windstorm risk: Which windstorm footprint characteristics are most damaging?

Evaluating the importance of spatial complexity and uncertainty in predicting and managing floods

Forecasting volcanic ash transport using satellite imagery and dispersion modelling

Impact of inaccurate earthquake magnitude to tsunami loss estimation: A tsunami early warning perspective

Incorporating tectonic information in probabilistic seismic hazard analysis: The effect of infrequent large earthquakes in the Malawi Rift

National scale drought risk and adaption modelling for Great Britain: Infrastructure strategies to 2050

Next generation lahar models built on uncertainty analysis

Quantification of risks to bridges from erosion and blockage: An elicitation of expert views

Real-time forecasting of algal bloom risk for lakes and reservoirs

Reducing uncertainty in streamflow predictions using reverse hydrology

Tailloss: Evaluating the risk of insolvency by estimating the probability in the upper tail of the aggregate loss distribution

The impact of flood risk information visualization on house purchasing decisions

CREDIBLE Uncertainty and Robustness Estimation toolbox (CURE)

Using weather forecasts to optimally issue severe weather warnings

Case Study 16: The impact of flood risk information visualization on house purchasing decisions

Barnaby Dobson, University of Bristol

Jolyon Miles-Wilson, University of Bristol

Iain Gilchrist, University of Bristol

David Leslie, Lancaster University

Thorsten Wagener, University of Bristol

DOWNLOAD

THE CHALLENGE

Stakeholder consideration is becoming an increasingly important issue in flood risk management, which leads to a requirement for understanding how information on flood risk is interpreted and used for decision-making. The need for improved public awareness regarding flood hazards is also becoming increasingly evident, especially in the context of the ongoing debate on the potential impacts of climate change. Researchers and governmental bodies currently emphasise the need of publicly available flood risk information on which individuals can base appropriate flood mitigation strategies.

While there is increasing recognition of the need for public consideration, actual quantitative investigations into human behaviour related to using flood risk information are still limited. Within this context, a much recommended but little explored question is how to communicate flood risk information to members of the public so that they can make informed decisions.

WHAT WAS ACHIEVED

Our key finding is that the visual format of flood-risk information influences risk perception when presented to members of the public. We observed that viewers found it more difficult to distinguish different levels of flood risk when presented with maps than when the same information was presented in graphical or tabulated form. Feedback from participants in our study suggested that the reason for this difficulty was that maps were hardest to use. This outcome is particularly relevant for flood-risk communicators in countries that currently employ flood hazard maps as their primary method for communication. When presenting information to the public they may wish to carefully consider their audience and intended message; maps are useful to planners interested in large areas, but individuals find it hard to extract the more specific information they need.

Our findings also showed that the presence of flood risk information influences decision making in the context of house purchasing. We found that buyers became less likely to purchase a house if it was associated with a higher risk of flooding. Our study suggests that buyers are interested in the flood risk for the houses they considering purchasing if that risk is significant.

HOW WE DID IT

Our study was based on examining the response of participants to different types of flood risk visualization provided in the context of selecting a property to purchase. Participants were selected on the basis of being either previous home buyers or actively seeking to purchase a home at the time of testing.

We compared three ways of presenting the same flood risk information: (i) the map format of presentation currently used by the UK Environment Agency, (ii) a table format, similar to the well-known energy rating labels, that presents flood depth information in combination with flood frequency information, and (iii) a graphical representation depicting the depth-frequency combination using a sketch house image as a physical referent.

During the experiment participants were presented with a computer screen with a series of trials in which information about two houses was presented side by side. Participants were asked to make a forced choice preference judgement between these pairs of houses to indicate which house they would consider purchasing.

Visualisation maps

The three ways of presenting the flood risk information that were used on the real estate pages: Table (top row); Graphic (middle row) and Map (bottom row) for three levels of risk: Low Risk (first column); Medium Risk (second column); High Risk (third column).

Case Study 15: A tool for understanding and quantifying model uncertainty: Sensitivity Analysis For Everybody (SAFE)

Francesca Pianosi, University of Bristol

Thorsten Wagener, University of Bristol

DOWNLOAD

THE CHALLENGE

Our goal was to provide a suite of tools and methods to support uncertainty and risk assessment in natural hazards – to improve the transparency and defensibility of risk management decisions.

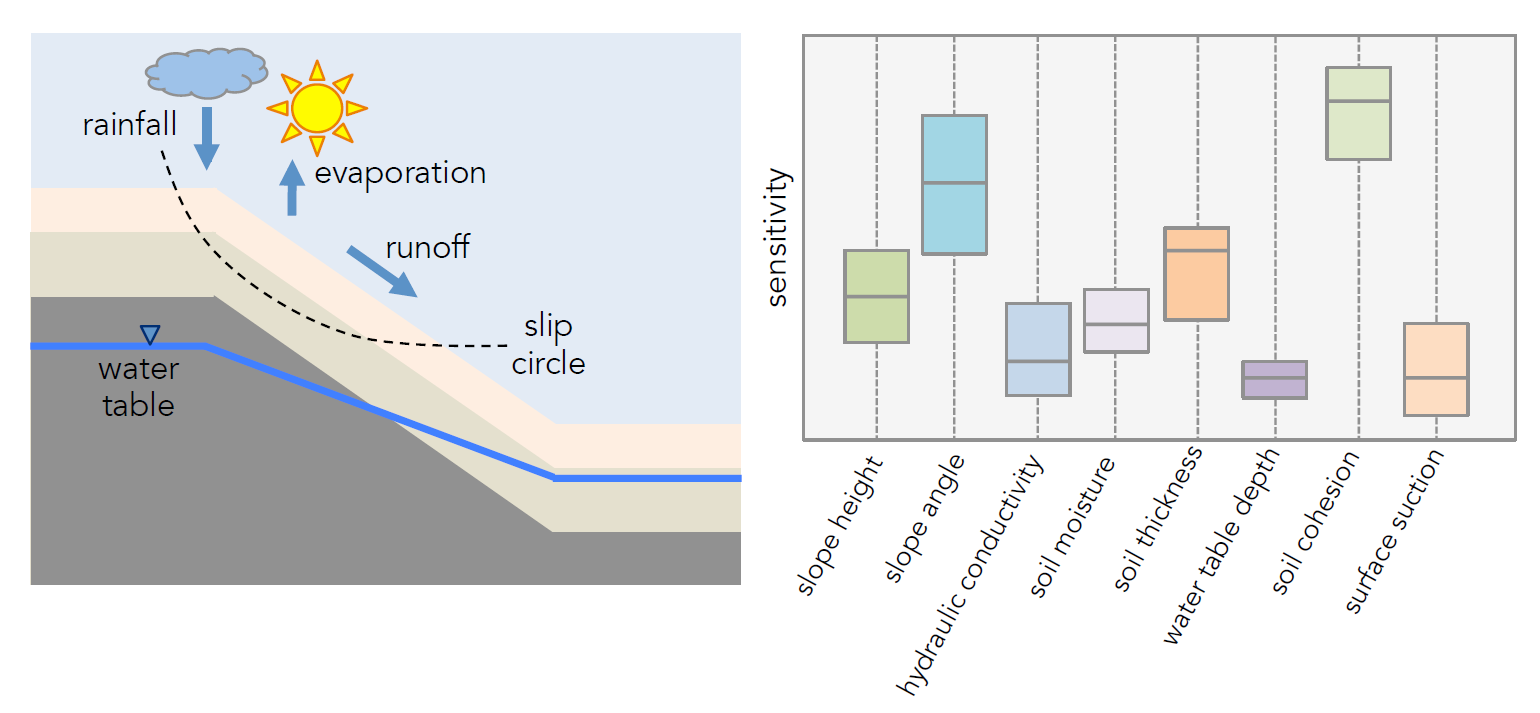
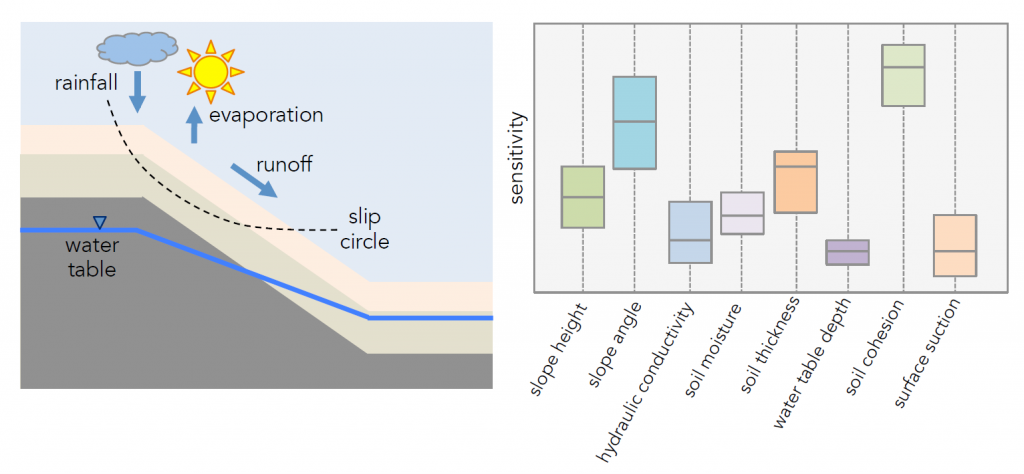
Good modelling practice requires an assessment of the confidence in a model.  Predictions arising from numerical models are affected by potentially large uncertainties due to a range of factors, such as observation errors and uncertainty in model parameters and structure.  Depending on the model application, such uncertainties can undermine the robustness and credibility of the modelling results to the extent that the usefulness of environmental models for supporting decision-making must called into question.  Global Sensitivity Analysis (GSA) provides a valuable tool for both model developers and users to quantify the uncertainty in model outputs, estimate the relative contribution of the different input factors to such uncertainty, and thus prioritize efforts for its reduction.

Sensitivity analysis is recommended practice when model predictions are the substance of regulatory analysis or policy appraisal.

WHAT WAS ACHIEVED

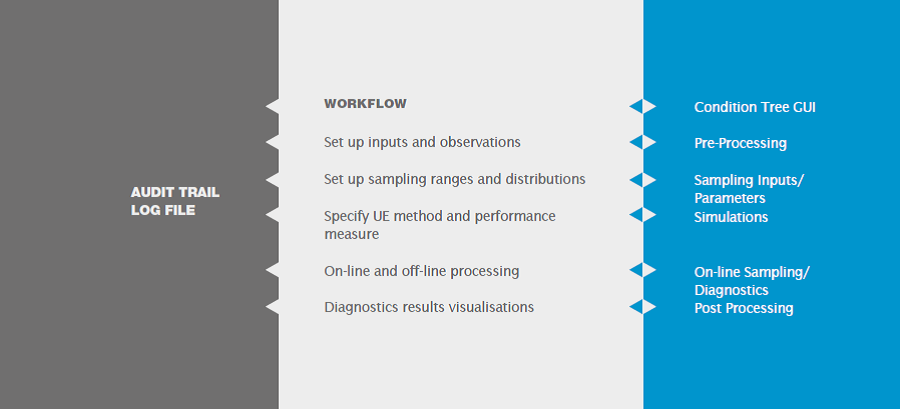
The SAFE tool allows those who use and develop models – in academia, government and industry – to investigate the potential for model simplification by identifying model components that have little impact on model behaviour and therefore can be omitted in a simplified version of the model.  It also supports model calibration by identifying the parameters that most influence model accuracy (i.e. the ability to reproduce observations) and therefore need to be properly calibrated.  Further, SAFE supports model validation by checking consistency between the model response and our understanding of the system represented by the model, and model debugging by identifying combinations of input factors (model parameters, initial or boundary conditions, input data, etc.) that cause the model to fail.  Finally, SAFE enables the user to identify the major sources of model uncertainty e.g. errors in input data or uncertainty in parameters, and thus to prioritize efforts for uncertainty reduction.

SAFE currently has over 300 academic users in a wide range of application areas.  It is being trialled by industrial users, including catastrophe risk modelling companies, environmental consultants, technology and manufacturing companies.

“The SAFE toolbox, and the thinking behind it, are helping us to get more out of the models we use in assessing strategies for cost-effective river water quality monitoring, ultimately supporting decisions about catchment management to meet the requirements of the European Water Framework Directive” (Rob Lamb, JBA)

HOW WE DID IT

The SAFE Toolbox provides a set of functions to perform Global Sensitivity Analysis in Matlab (or equivalently in the free software Octave) and R.

GSA methods implemented in SAFE:

  • Elementary Effects Test (or method of Morris)
  • Regional Sensitivity Analysis (RSA)
  • Variance-Based Sensitivity Analysis (Sobol’)
  • Fourier Amplitude Sensitivity Test (FAST)
  • DYNamic Identification Analysis (DYNIA)
  • Density-based PAWN Sensitivity Analysis (Pianosi and Wagener, 2015)

The unique features of SAFE:

  • Modular structure to facilitate interactions with other computing environments
  • Set of functions to assess the robustness and convergence of sensitivity indices
  • Several visualization tools to investigate and communicate GSA results
  • Lots of comments in the code and workflow examples to get started

A general introduction to the rationale and architecture of SAFE is given in Pianosi et al. (2015).

A literature review of global sensitivity analysis techniques was undertaken. This formed the basis for the techniques incorporated in the SAFE software package.  In performing the literature review it also became clear that there was a need for additional methods to be developed.  Following from this, a novel approach to global sensitivity analysis was produced based on cumulative distribution functions. The method is named PAWN (Pianosi and Wagener, 2015).

landslides pic

REFERENCES

More information is available from the SAFE webpage: http://www.bris.ac.uk/cabot/resources/safe-toolbox/

Pianosi, F. and Wagener, T. (2015) A simple and efficient method for global sensitivity analysis based on cumulative distribution functions.  Environmental Modelling & Software 67: 1-11.

Pianosi, F., Sarrazin, F. and Wagener, T. (2015) A Matlab toolbox for Global Sensitivity AnalysisEnvironmental Modelling & Software 70: 80-85.

Sarrazin, FJ, Pianosi, F & Wagener, T, 2016, ‘Global Sensitivity Analysis of environmental models: Convergence and validation’. Environmental Modelling and Software, vol 79., pp. 135-152

Pianosi, F, Beven, K, Freer, JE, Hall, JW, Rougier, J, Stephenson, DB & Wagener, T, 2016, ‘Sensitivity analysis of environmental models: A systematic review with practical workflow’. Environmental Modelling and Software, vol 79., pp. 214-232

Case Study 14: European windstorm risk: Which windstorm footprint characteristics are most damaging?

Laura Dawkins, University or Exeter

David Stephenson, University of Exeter

Ken Mylne, Met Office

DOWNLOAD

The Challenge

Windstorms are the 2nd largest cause of global insured loss and are a major contributor to losses in Europe. Extreme, damaging European windstorms have differing characteristics. Some cover a large area reaching relatively low wind gust speeds, while others cover a smaller area reaching much higher wind gust speeds. A better understanding of the relative damage caused by the spatial and intensity characteristics of a windstorm is therefore required. Key Question: Which windstorm footprint characteristics are most damaging?

The severity of a windstorm hazard event is often summarised in terms of its footprint, defined as the maximum wind gust speed to occur at a set of spatial locations over the duration of the storm. This project aimed to develop and critically apply a statistical methodology to explore the relationship between windstorm footprint characteristics and insured loss to address this question. This improved understanding will be used to help explain the surprising decline in windstorm related insured losses in the 21st century, previously identified by both academics and insurers.

What We Have Achieved

A better understanding of the influence of windstorm footprint characteristics on insured loss has been achieved. The local intensity characteristics of the footprint have been shown to have more effect on insured loss than the spatial dependence structure characteristics. The local intensity was shown to have decreased in the 21st century, related to a change in the North Atlantic Oscillation, a large scale atmospheric mode of variability.

This insight involved the development of a novel geostatistical windstorm hazard footprint model. The project involved a unique application of the sensitivity analysis method developed within the CREDIBLE project to this complex stochastic hazard model. This provides an important example for future users of this method.

This statistical windstorm footprint hazard model allows for fast simulation of realistic synthetic windstorm footprints (~3 seconds on a standard laptop). This simulation speed could be very effectively utilised to explore windstorm risk, for example in the insurance industry, where currently much slower atmospheric models are used to create synthetic windstorm footprints. Future planned applications of the statistical footprint model will involve working with the insurance industry and the Met Office.

How We Did It

This project benefited from a recent large data set of 5730 regionally downscaled historical windstorm footprints from winters (October-March) 1979-2012 (kindly modelled by J. Standen and provided by J. Roberts of the Met Office). The investigation was carried out in three stages:

(1) Firstly, a number of storm severity measures, functions of extreme footprint wind gust speeds which represent multiple characteristics of the footprint, were developed based on existing measures in the literature, to explore which best represent European wide insured loss.

(2) Secondly, a spatial geostatistical model for windstorm footprints was developed for the whole European domain with 3 parameters for the wind intensity (1-3) and 3 for the footprint spatial dependence structure (4-6). This model was used to produce synthetic footprints with varying characteristics, which were used in a PAWN sensitivity analysis study (Pianosi and Wagener, 2015) to explore which characteristics have most influence on insured loss, approximated by the footprint damage area.

(3) Lastly, the damage area of historical storms was compared to the North Atlantic Oscillation phase to explore the reasons for the 21st century decline in windstorm related losses (more detail in Dawkins et. al, 2016).

Figure1&2

References

Dawkins, L. C., Stephenson, D. B., Lockwood, J. F., and Maisey, P. E.: The 21st Century Decline in Damaging European Windstorms, Natural Hazards Earth System Sciences Discussion, in review, 2016

Pianosi, F & Wagener, T, 2015, ‘A simple and efficient method for global sensitivity analysis based on cumulative distribution functions’. Environmental Modelling and Software, vol 67., pp. 1-11

Case Study 13: National scale drought risk and adaptation modelling for Great Britain: Infrastructure strategies to 2050

Mike Simpson, University of Oxford

Jim Hall,University of Oxford

Matt Ives, University of Oxford

DOWNLOAD

THE CHALLENGE

Protecting Britain’s drinking water, farming, energy and industry systems from drought in the context of increasing demands and a changing climate will require sustained investment. Even within a national picture where overall supply exceeds demand, heterogeneity of water availability in space and time leads to expensive and damaging water shortage. In order to cope with this pressure, the natural systems that provide water supplies can be augmented through engineered infrastructure. The challenge for drought management in the 21st Century lies in the implementation of appropriate solutions that can meet changing requirements without compromising the environment and other users of water, or placing excessive financial burden on citizens. Traditional storage and transfer technologies are required in parallel with new ideas for water supply and efficiency of water use. Establishing the appropriate combination of these options is a complex engineering and economic systems problem. With growing pressure on water supplies and major investment decisions ahead, a more strategic national approach is required.

WHAT WAS ACHIEVED

We found that investment in new technologies and system efficiencies were most likely to result in a secure, low-carbon water resource system. Strategies which follow conventional engineering approaches, including those with a long term perspective, were environmentally more consequential and led to lower supply/demand margins by 2050 due to their implicit inefficiencies. However, strategies based entirely on efficiency or new technologies could not meet demand across the country and therefore mixed strategies were required. Climate change and demographic scenarios have complex interaction, with dry climate scenarios leading to localised problems in the south and east, and population growth scenarios causing impact more broadly across England and Wales. Generally, vulnerability to drought is prevalent across Southern England, with the North of England and Wales at risk in more extreme scenarios.

HOW WE DID IT

Our drought model relies on a simplified reconstruction of the existing regional water resource management arrangements in Britain. Mainland Great Britain is divided in 130 Water Resource Zones (WRZ), or Megazones in Scotland. Models of water availability of each WRZ determine values for potential water supply (deployable output). This includes river intakes, reservoir intakes and groundwater. Flows values are taken from the National River Flow Archive, with recorded flow scaled to the representative river intake flow or reservoir watershed on the basis of sub-catchment area. Reservoirs are modelled as a single storage with maximum capacity set to the total capacity for reservoirs in the WRZ.

Water demand for each WRZ is the sum of domestic and non-domestic demand. Domestic demand for a WRZ is determined by multiplying the projected population of the by the average per capita water demand for the WRZ. Non-domestic demand is calculated as a percentage of domestic demand for a given WRZ based on current region figures.

Alternative water supply options include desalination, aquifer recharge, demand reduction, effluent re-use, leakage reduction, inter-company transfers, and new ground water supplies. Investment and operating costs for each of these options are based on a series of regression analyses of estimated costs against yields taken from 800 examples of water infrastructure projects. Climate change and population scenarios are used to modify supply and demand figures. Strategies are implemented using weighted preferences for water resource options.

maps

REFERENCEs

Simpson, M., Ives, M. C., Hall, J., Kilsby, C., 2016, Water Supply Systems Assessment, In Hall, J., Tran, M., Hickford, A. and Nicholls, R. (eds.), The Future of National Infrastructure: A Systems-of-Systems Approach, Cambridge University Press: Cambridge

Simpson, M., James, R., Hall, J., Borgomeo, E., Ives, M., Almeida, S., Kingsborough, A., Economou, T., Stephenson, D., and Wagener, T. (Accepted for publication 2016), Decision Analysis for Management of Natural Hazards, Annual Review of Environment and Resources

Case Study 12: Quantification of risks to bridges from erosion and blockage: An elicitation of expert views

Rob Lamb, JBA Trust

Willy Aspinall, University of Bristol / Aspinall & Associates

Thorsten Wagener, University of Bristol

DOWNLOAD

THE CHALLENGE

Scour is a process of localised erosion that can undermine the foundations of infrastructure assets such as bridges, culverts and weirs. It is often associated with high flow or extreme flood events, and can cause costly damage leading to compromised safety, service restrictions and, in extreme cases, to structural collapse. A recognised hazard for road and rail networks, scour is managed through the application of risk assessment, monitoring and maintenance protocols. These protocols are undoubtedly effective in reducing risk by highlighting incipient problems, triggering maintenance or other risk reduction actions. However, evidence of scour-related bridge failures indicates that some residual risk remains. This risk is difficult to manage, representing a combination of rare events and uncertainties about the actual (as opposed to designed) response of assets to flooding.

Our aim was to explore uncertainties about the vulnerability of bridges to scour – to inform the development of fragility functions that could be applied within a broad-scale risk modelling framework and used to inform and support decision making.

WHAT WAS ACHIEVED

Robust assessments of fragility will bring greater consistency and confidence for various stakeholders in assessing risks to bridges – with the ultimate aim being to reduce societal risk and economic impacts associated with scour events.

Whilst this study was not intended to progress to a fully descriptive set of comprehensive fragility functions for bridge scour risks, the quantitative uncertainty results and accompanying findings will inform their development.

In the longer term, this study will assist bridge owners and those authorities responsible for regulating bridge operations to formulate policies and strategies going forward for new build and for a continually ageing portfolio of structures with changing scour-induced risk situations, such as evolving river conditions, changing management regimes and progressive societal risk aversion.

HOW WE DID IT

The nature of the problem lends itself to expert judgement. Bridge scour involves multiple complex physical processes, with many uncertain factors (such as future flood intensities, debris accumulation, and changes in river geomorphology), coupled with uncertainties associated with the heterogeneity of bridge infrastructure assets, including the nature of their foundations – all of which make it difficult to arrive at an assessment of vulnerability to failure from basic visual inspection, empirical observations or statistical analysis. In these circumstances, the knowledge and judgement of experts constitutes an especially valuable source of information.

Soliciting expert advice for decision support is not new. Generally, however, it has been pursued on an informal basis. Here, a structured approach to capturing expert judgements was applied, designed to tie the process to explicit and transparent methodological rules, with the goal of treating expert judgements in the same way as other scientific data.

An international expert elicitation workshop on bridge scour risk assessment was held in London in February 2015. The workshop brought together 17 experts from the UK, USA, New Zealand and Canada, including representatives from industry, academic researchers, and public agencies.

The elicitation was a two-stage process. In the first stage, a categorical approach was used to examine which factors determine the likelihood of scour at a bridge, and how experts think those factors should be ranked in importance. The second stage involved a quantitative assessment of bridge failure probabilities for a range of plausible scenarios under stated conditions and assumptions. The elicitation techniques included methods to weight information from the group of experts so as to promote the most accurate and unbiased judgement of uncertainty (using control questions to ‘calibrate’ the experts’ responses).

Crowther Bridge - Failed

Case Study 11: Impact of inaccurate earthquake magnitude to tsunami loss estimation: A tsunami early warning perspective

Katsu Goda, University of Bristol

Kamilla Abilova, University of Oxford (CREDIBLE summer research student)

DOWNLOAD

THE CHALLENGE

Issuing accurate and prompt tsunami warnings to residents in coastal areas is critically important for mega-thrust tsunamigenic earthquakes. During the initial phase, it requires reliable estimation of key earthquake source characteristics, such as magnitude and location. The estimation of earthquake information is usually accurate and prompt, however, for very large earthquakes satisfactory performance may not be achieved during the early phase of evacuation. This can be exemplified for the 2011 Tohoku tsunami case, where the first estimate of the magnitude was 7.9 (3 minutes after the earthquake) and the correct estimate of the magnitude of 9.0 was reached 134 minutes after the earthquake. Consequently, tsunami warnings issued by the Japan Meteorological Agency underestimated the observed tsunami significantly (3 to 6 m versus 10+ m).

This study investigated the effects due to underestimation of the earthquake source parameters in the context of tsunami early warning and tsunami risk assessment. For this purpose, a new comprehensive probabilistic tsunami loss model for large magnitude earthquakes in the Tohoku region of Japan was developed, generating a tsunami loss curve for a building portfolio by considering uncertainties in earthquake source parameters. By analysing the estimated tsunami loss for coastal cities and towns in Miyagi Prefecture (case study location), potential biases due to underestimation of earthquake magnitude were quantified. These results provided useful insights regarding the importance of deriving accurate seismic information and were compared with the effects due to uncertain source characteristics (e.g. geometry and spatial slip distribution) for given moment magnitudes, which is unavoidable in making risk predictions based on macroscopic earthquake parameters only.

WHAT WAS ACHIEVED

For the Tohoku tsunami case study, we found that the tsunami loss generation process is exponential with respect to earthquake magnitude. Therefore, biases/errors in earthquake source information (magnitude and hypocenter location) can have major influence on the potential consequences of the tsunami event in the context of tsunami early warning and risk prediction. At the median probability level, for instance, total tsunami loss increases by about a factor of 100 from M8.0 to M9.0 scenarios. We also quantified the variability of the tsunami loss curves due to uncertain earthquake rupture characteristics that were not captured by the macroscopic earthquake information. The within-scenario variability of tsunami loss was comparable with the tsunami loss differences caused by the biases in earthquake magnitude.

HOW WE DID IT

The 2011 Tohoku earthquake was focused on as a case study to illustrate the significance of the effects of issuing inaccurate tsunami warnings on the tsunami risk predictions from a retrospective perspective. In the case study, a building portfolio consisting of about 86,000 buildings in Miyagi Prefecture was considered.

The problem was set up as follows. A tsunami event of M9.0 in the offshore areas of the Tohoku region was adopted as reference. The magnitude of this event may be underestimated significantly during the early stage of the disaster (as was the case for the 2011 tsunami). The underestimated scenarios were represented by a set of earthquake scenarios with lower moment magnitudes than the reference scenario. For each assumed scenario, stochastic source models were generated by taking into account uncertainty of tsunami source characteristics. Using the multiple sets of tsunami source models corresponding to different moment magnitudes, probabilistic tsunami loss estimation was carried out. In total, six scenario magnitudes from M8.0 to M9.0 were considered, and for each magnitude 100 stochastic source models were generated to represent the within-scenario uncertainty of the earthquake rupture.

In the study, two questions were considered: (i) when the magnitude is in error, what would be the impact in terms of tsunami loss prediction? and (ii) what is the uncertainty of predicted tsunami loss given a moment magnitude and hypocentre location? The former is relevant when the warnings need to be given shortly after a very large seismic event, whereas the latter is always present in issuing tsunami early warnings.

To evaluate the economic consequences due to tsunami events with different scenario magnitudes, probability distributions of tsunami loss for the building portfolio were obtained for different magnitude values. The tsunami loss curves became more severe with increasing magnitude. Practically, this meant that the over-/underestimation of earthquake magnitude by certain units in the tsunami warning might correspond to very different situations in terms of potential consequences. On the other hand, the within-scenario variability of the tsunami loss curve was caused by the uncertainty associated with detailed earthquake slip characteristics that were not captured by the macroscopic earthquake information. This variability was found to be significant, and the main contributor of the variability was the spatial slip distribution, especially the location and extent of major asperities with respect to the building portfolio. Importantly, the within-scenario variability of tsunami loss was grossly comparable with the tsunami loss differences caused by the bias in earthquake magnitude.

Tsunami small

REFERENCES

Goda, K. and Abilova, K. (2016). Tsunami hazard warning and risk prediction based on inaccurate earthquake source parameters. Natural Hazards and Earth System Sciences, 16. http://www.nat-hazards-earth-syst-sci.net/16/577/2016/nhess-16-577-2016.html

Case Study 10: Tailloss: Evaluating the risk of insolvency / estimating the probability in the upper tail of the aggregate loss distribution

Isabella Gollini*, Birkbeck, University of London

Jonathan Rougier, University of Bristol

*This research was developed while Isabella Gollini was on a postdoctoral fellowship in the CREDIBLE project at the University of Bristol

DOWNLOAD

THE CHALLENGE

The main aim of this project was to evaluate the risk of insolvency, as the probability that the annual loss will exceed the company’s current operating capital.

One of the objectives in catastrophe modelling is to assess the probability distribution of losses for a specified period, such as a year.  From the point of view of an insurance company, the whole of the loss distribution is interesting, and valuable in determining insurance premiums.  But the shape of the right hand tail is critical, because it impinges on the solvency of the company.  A simple measure of the risk of insolvency is the probability that the annual loss will exceed the company’s current operating capital.  Ensuring an upper limit on this probability is one of the objectives of the EU Solvency II directive.

WHAT WAS ACHIEVED

Using results from Probability Theory, we derived four upper bounds and two approximations for the upper tail of the loss distribution that follows from an Event Loss Table.  We argue that in many situations an upper bound on this probability is sufficient.  For example: to satisfy the regulator, in a sensitivity analysis, or when there is supporting evidence that the bound is quite tight.  Of the upper bounds we have considered, we find that the Moment bound offers the best blend of tightness and computational efficiency.  In fact, the Moment bound is effectively costless to compute, based on the timings from our R package.

HOW WE DID IT

What did you do during the project to deliver its achievements and outcomes? This section can be more technical but it doesn’t have to be. You can include additional images or diagrams if you wish.  Avoid using jargon and acronyms. What will interest the reader and a wide audience of people? (180-280 words depending on the use of diagrams, images or figures)

We explored six different approaches to evaluate the annual loss distribution: Monte Carlo simulation and Panjer recursion, both of which are widely used but also very computationally expensive, and four upper bounds which are effectively costless to compute. We demonstrated the conditions under which the upper bounds are tight, and the appropriate size for Monte Carlo simulations.  We presented a numerical illustration of all the methods proposed using a large Event Loss Table (with 32,060 events) concerning US hurricane data, and used this challenging application to assess the various methods, carried out in our ‘tailloss’ package for the R computing environment.

Tailloss

REFERENCE OR LINKS                    

Gollini, I., and Rougier, J., (in press) “Rapidly Bounding the Exceedance Probabilities of High Aggregate Losses”, The Journal of Operational Risk. Preprint: http://arxiv.org/abs/1507.01853

Gollini, I., and Rougier, J., (2015) “Tailloss: An R package to Estimate the Probability in the Upper Tail of the Aggregate Loss Distribution” https://cran.r-project.org/web/packages/tailloss/index.html

http://www.risk.net/type/journal/source/journal-of-operational-risk

Case Study 9: Credible project Uncertainty and Robustness Estimation toolbox (CURE)

Trevor Page, Lancaster University

Paul Smith, Keith Beven, Lancaster University

Francesca Pianosi, Fanny Sarrazin, Suzanna Almeida, Liz Holcome, Jonty Rougier, Jim Freer and Thorsten Wagener, University of Bristol

Michael Hollaway, Lancaster University

DOWNLOAD

THE CHALLENGE

There is a general trend for increasing inclusion of uncertainty estimation (UE) in environmental and hazard modelling because the effective use of model results in decision making requires a level of confidence to be established.  Another requirement is the assessment of the implicit and explicit choices and assumptions made during the modelling and UE process (Rougier and Beven, 2013). In particular, assumptions made regarding the nature of epistemic uncertainties (uncertainties relating to a lack of knowledge), and how they are taken account of, should be recorded and communicated  to stakeholders such that the meaning of the results and any subsequent analysis is put into context.  Good practice in this respect is still developing and is integral to the CREDIBLE Uncertainty and Robustness Estimation Toolbox (CURE), which aims to represent best practice in applying UE methods as well as best practice in being explicit about modelling choices and assumptions.  In this way CURE will contribute to the ongoing development and testing of UE methods and good practice in their application.

WHAT WAS ACHIEVED

The CURE toolbox consists of computer program functions which quantify uncertainties associated with simulation model results for a given application. It provides a broad range of different UE methods that users can apply that are demonstrated using various environmental model applications. Example applications are provided in the form of workflow scripts (sequences of computer program commands that link to CURE program functions) that demonstrate the different UE analysis methods and ultimately help users define and structure their own workflow scripts for their particular applications.  Apart from performing core calculations associated with individual UE methods, CURE functions compute additional modelling and UE diagnostics and results including visualisations that aid in the communication of uncertainty.  The recording of modelling choices and assumptions, including treatment of epistemic uncertainties, is facilitated by a Graphical User Interface (GUI) where users can information for inclusion in a modelling audit trail log. The audit log is an important component for the communication of the meaning of the uncertainty estimates, as it sets the context for the UE.

HOW WE DID IT

CURE is a fully open source toolbox written in the MATLABTM programming language.  As it is aimed at simulation models, it employs a range of different Monte Carlo methods for forward UE (i.e. the forward propagation of uncertainties through a model: e.g. using prior estimates of input and parameter uncertainty) and conditioned UE (i.e. where UE results are conditioned on observations). The UE methods included span both formal statistical and informal approaches, underpinned by different philosophies, such that users are able to explore various approaches.  Each approach and modelling application will include its own implicit and explicit modelling choices and assumptions recorded via the GUI. The GUI takes the form of a number of simple, sequential dialogue boxes where the user is asked to enter information, as text, in a structured way and which can be iteratively edited during any modifications to analyses. The toolbox structure is such that new methods can be easily added and it will be subject to ongoing development and augmentation with additional workflow examples.

CURE1 CURE2

REFERENCES

Rougier, J and Beven, K J, 2013. Model limitations: the sources and implications of epistemic uncertainty, in Rougier J, Sparks, S and Hill, L, Risk and uncertainty assessment for natural hazards, Cambridge University Press: Cambridge, UK, 40-63

NERC, PURE, CREDIBLE (Consortium on Risk in the Environment: Diagnostics, Integration, Benchmarking, Learning and Elicitation) Project:  NE/J017450/1.

Case Study 8: Evaluating the importance of spatial complexity and uncertainty in predicting and managing floods

James Savage, University of Bristol

Paul Bates, University of Bristol

Jim Freer, University of Bristol

Thea Hincks, University of Bristol

DOWNLOAD

THE CHALLENGE

Floods are a major natural hazard that have affected millions of people throughout the world. Accurately predicting current flooding is critical in helping to mitigate against the impacts that flooding may have in the future. Computational hydraulic models are powerful tools that allow flood events to be simulated and mapped to understand areas that are at the greatest risk of being flooded. However, these models can take a long time to run, meaning that their use for real time decision making can be limited, especially when running multiple simulations to understand the uncertainty of the prediction. One solution is to run models at a coarser spatial resolution, which reduces the run time of a simulation, but the effect of this alongside other uncertainties is unknown. This project applied novel approaches developed elsewhere in the CREDIBLE project to investigate how uncertainty and model spatial complexity trade off against each other in making probabilistic flood inundation predictions

WHAT WAS ACHIEVED

Our results allow modellers to identify the simplest and most efficient model capable of achieving a specific levels of accuracy.  By using the simplest acceptable model users then have the time to undertake more testing and analysis, and to better characterize how likely errors in model input data will affect the quality of the predictions.  By applying our methods to the Carlisle 2005 flood event we were also able to demonstrate how complex hydraulic models can be utilised more quickly to allow their predictions to inform real time decision making.

HOW WE DID IT

We took a state of the art flood inundation model developed at the University of Bristol and applied this to simulate a flood in the Imera River in Sicily for which we had high quality terrain data and observations of the maximum water height at various locations within the basin. We developed multiple models of this site at grid scales of 10m to 500m and looked at how the importance of different sources of error changed with grid resolution.  We were able to show that for the very highest modelling scales increasing grid resolution gave no improvement in predictions when other errors were taken into account.  In effect we showed that errors in e.g. model inflow meant that the apparent benefits of increased resolution were spurious beyond a particular threshold.

We used a new Global Sensitivity Analysis technique developed elsewhere in CREDIBLE to explore how influential spatial resolution and resampling of a fine scale Digital Elevation Model (DEM) are when compared to uncertainties in the Manning’s friction coefficient parameters and the inflow hydrograph providing the boundary conditions.  We found that the sensitivity of flood inundation models to these different factors was far more variable in space and time than was previously known.

In combination, these methods allow us to identify the simplest and most efficient model capable of achieving specific levels of accuracy taking all model errors into account.

Finally, we used a flood inundation model that was trained on a simulation of the Carlisle 2005 flood and built up a catalogue of possible flood events by running many more model simulations. We then used Bayesian Belief Networks to provide very quick estimations of flood hazard across Carlisle. When coupled with decision theory we showed how these probabilistic predictions could be used to identify whether roads at risk of flooding should be closed in advance of a flood event occurring. Similar approaches could enable flood inundation models to be more widely adopted for real time flood decision making into the future.

flooded-491245 flood-139000